

Start Here

The Turnstile Substack is an institutional research publication covering production economics, contract efficiency, and prediction market (Polymarket) mispricing across MLS, MLS NEXT Pro, NWSL, and European football.
My thesis is that capital is culturally illiterate, that production value is systematically mispriced, and that an institutional reader with the right framework can see mispricings the market does not.
Every report on this Substack applies the same framework, Value Momentum Index (VMI), to manually verified datasets covering 2,164 players across MLS (1,013 players, 2020–2025) and MLS NEXT Pro (1,151 players, 2023–2025), with live 2026 tracking across both leagues.
This page defines the framework, the dataset, the track record, and the publication.
Methodology note: Turnstile publishes findings, calibration outputs, and tier classifications. Scoring weights, per-event valuation logic, threshold functions, and the underlying calculation engine specification remain proprietary and are not disclosed in research outputs. If you view the VMI Terminal then you are seeing structured outputs of the framework, not the operating manual.
First-time readers start here.
Returning readers use it as the index.
2,164 Players Across MLS and MLS NEXT Pro, 2020–2026
I have two coverage tiers running parallel, synergistically.
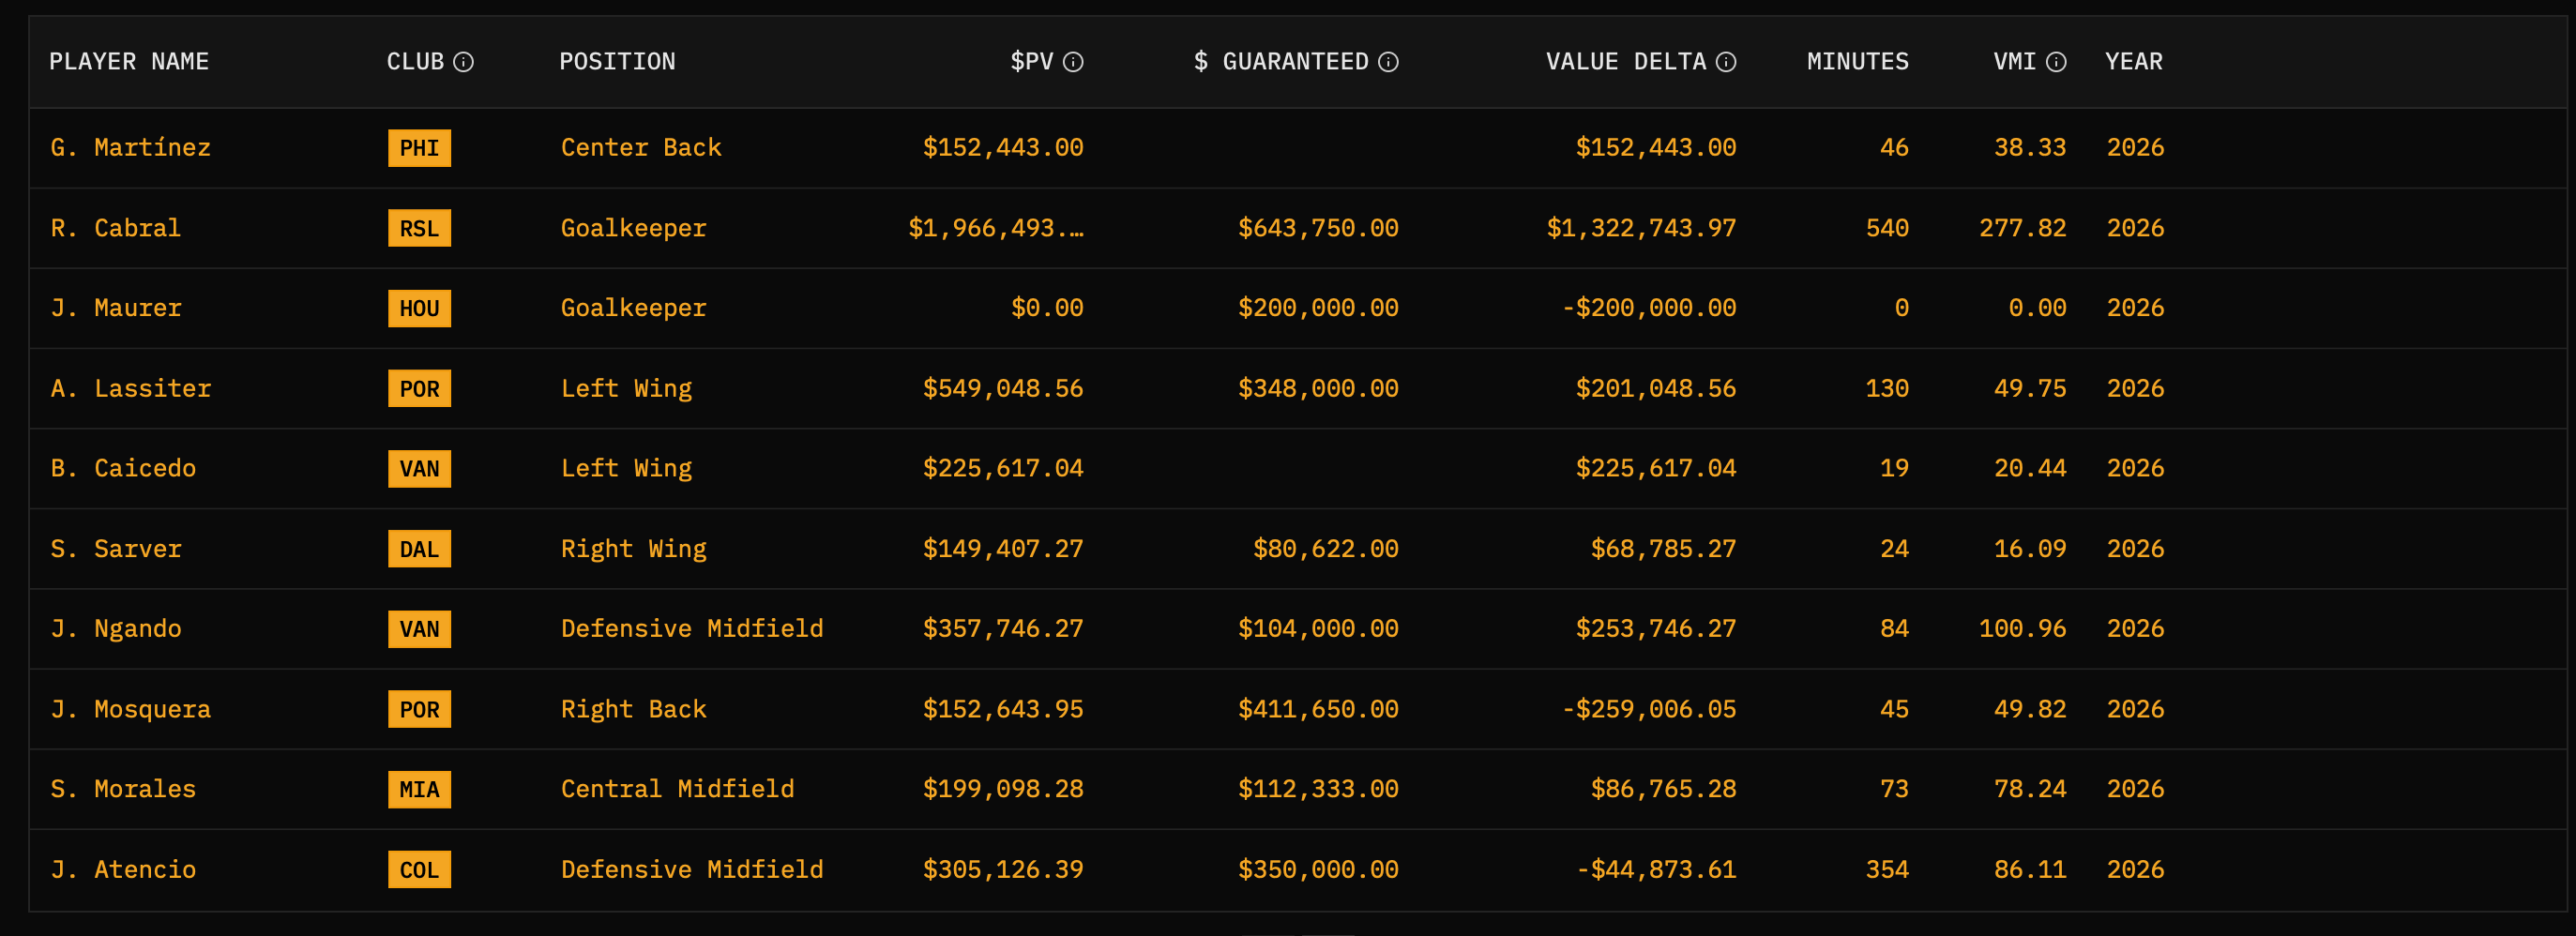
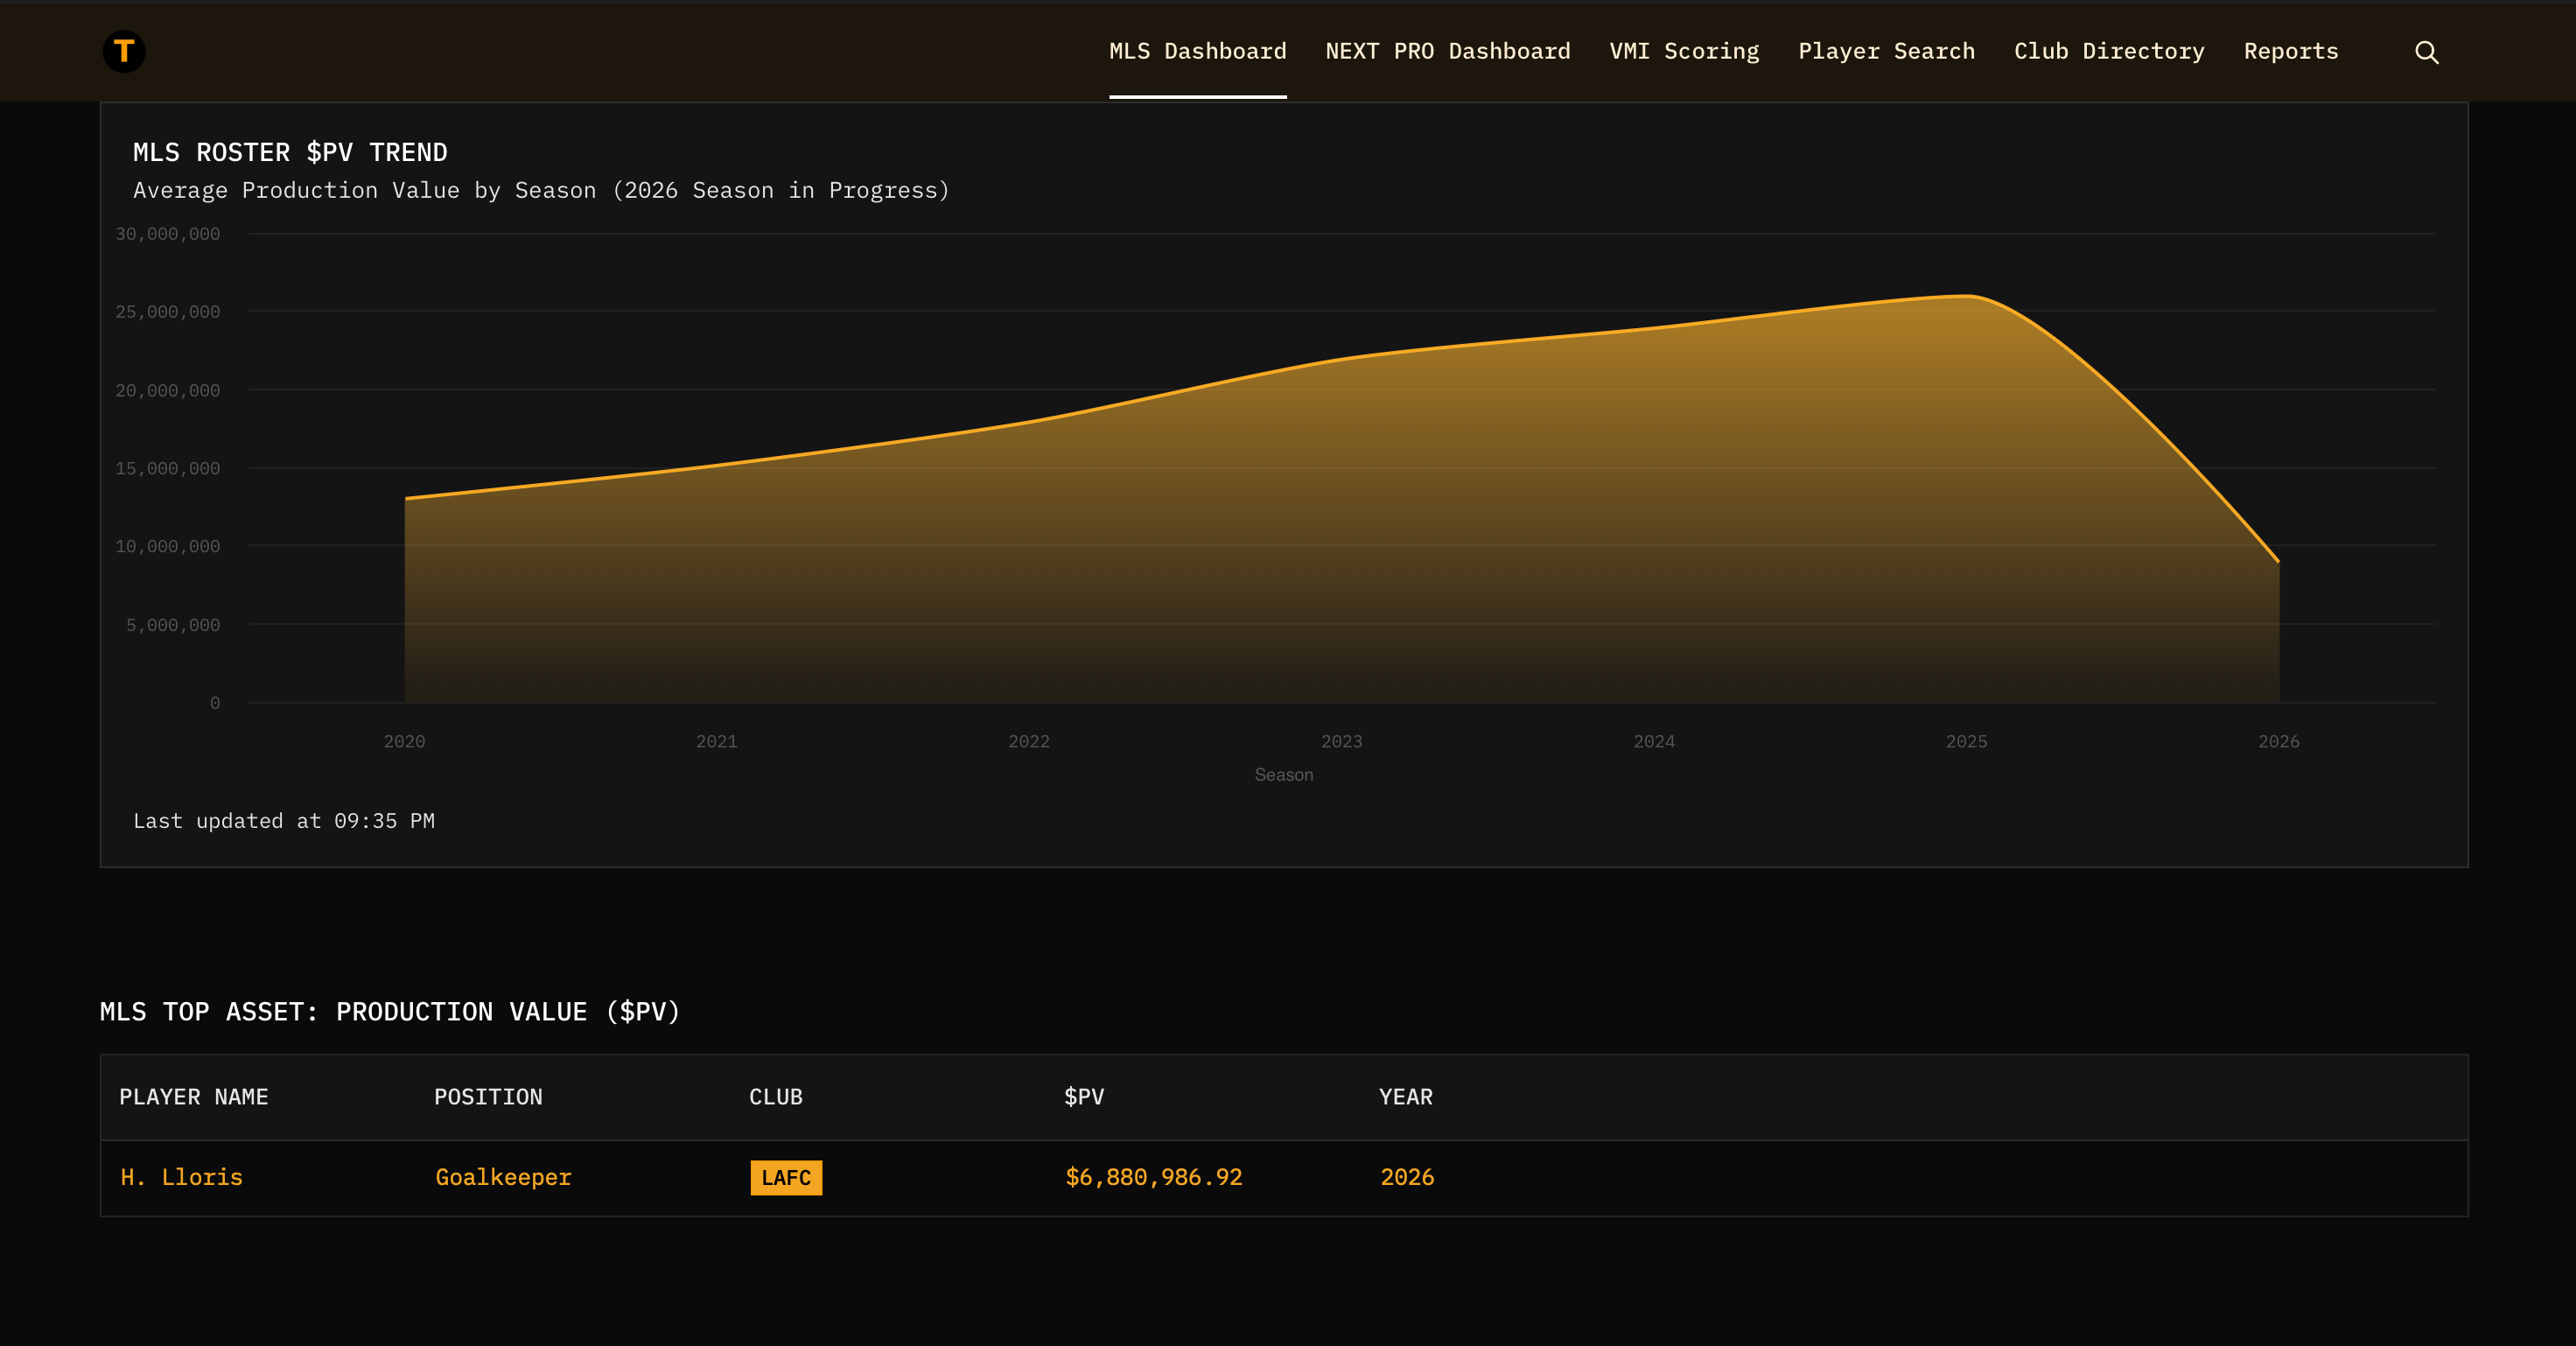
MLS. 1,013 players. 30 clubs. Six seasons of roster data, 2020 through 2025. 5,292 player-seasons. 2,761 matches. All salary records are independently verified against MLSPA disclosures (MLSPA, October 2025 release plus in-season updates). I do not scrape, there are no estimates, and the numbers are not synthetic. Live 2026 match tracking is updated week by week.
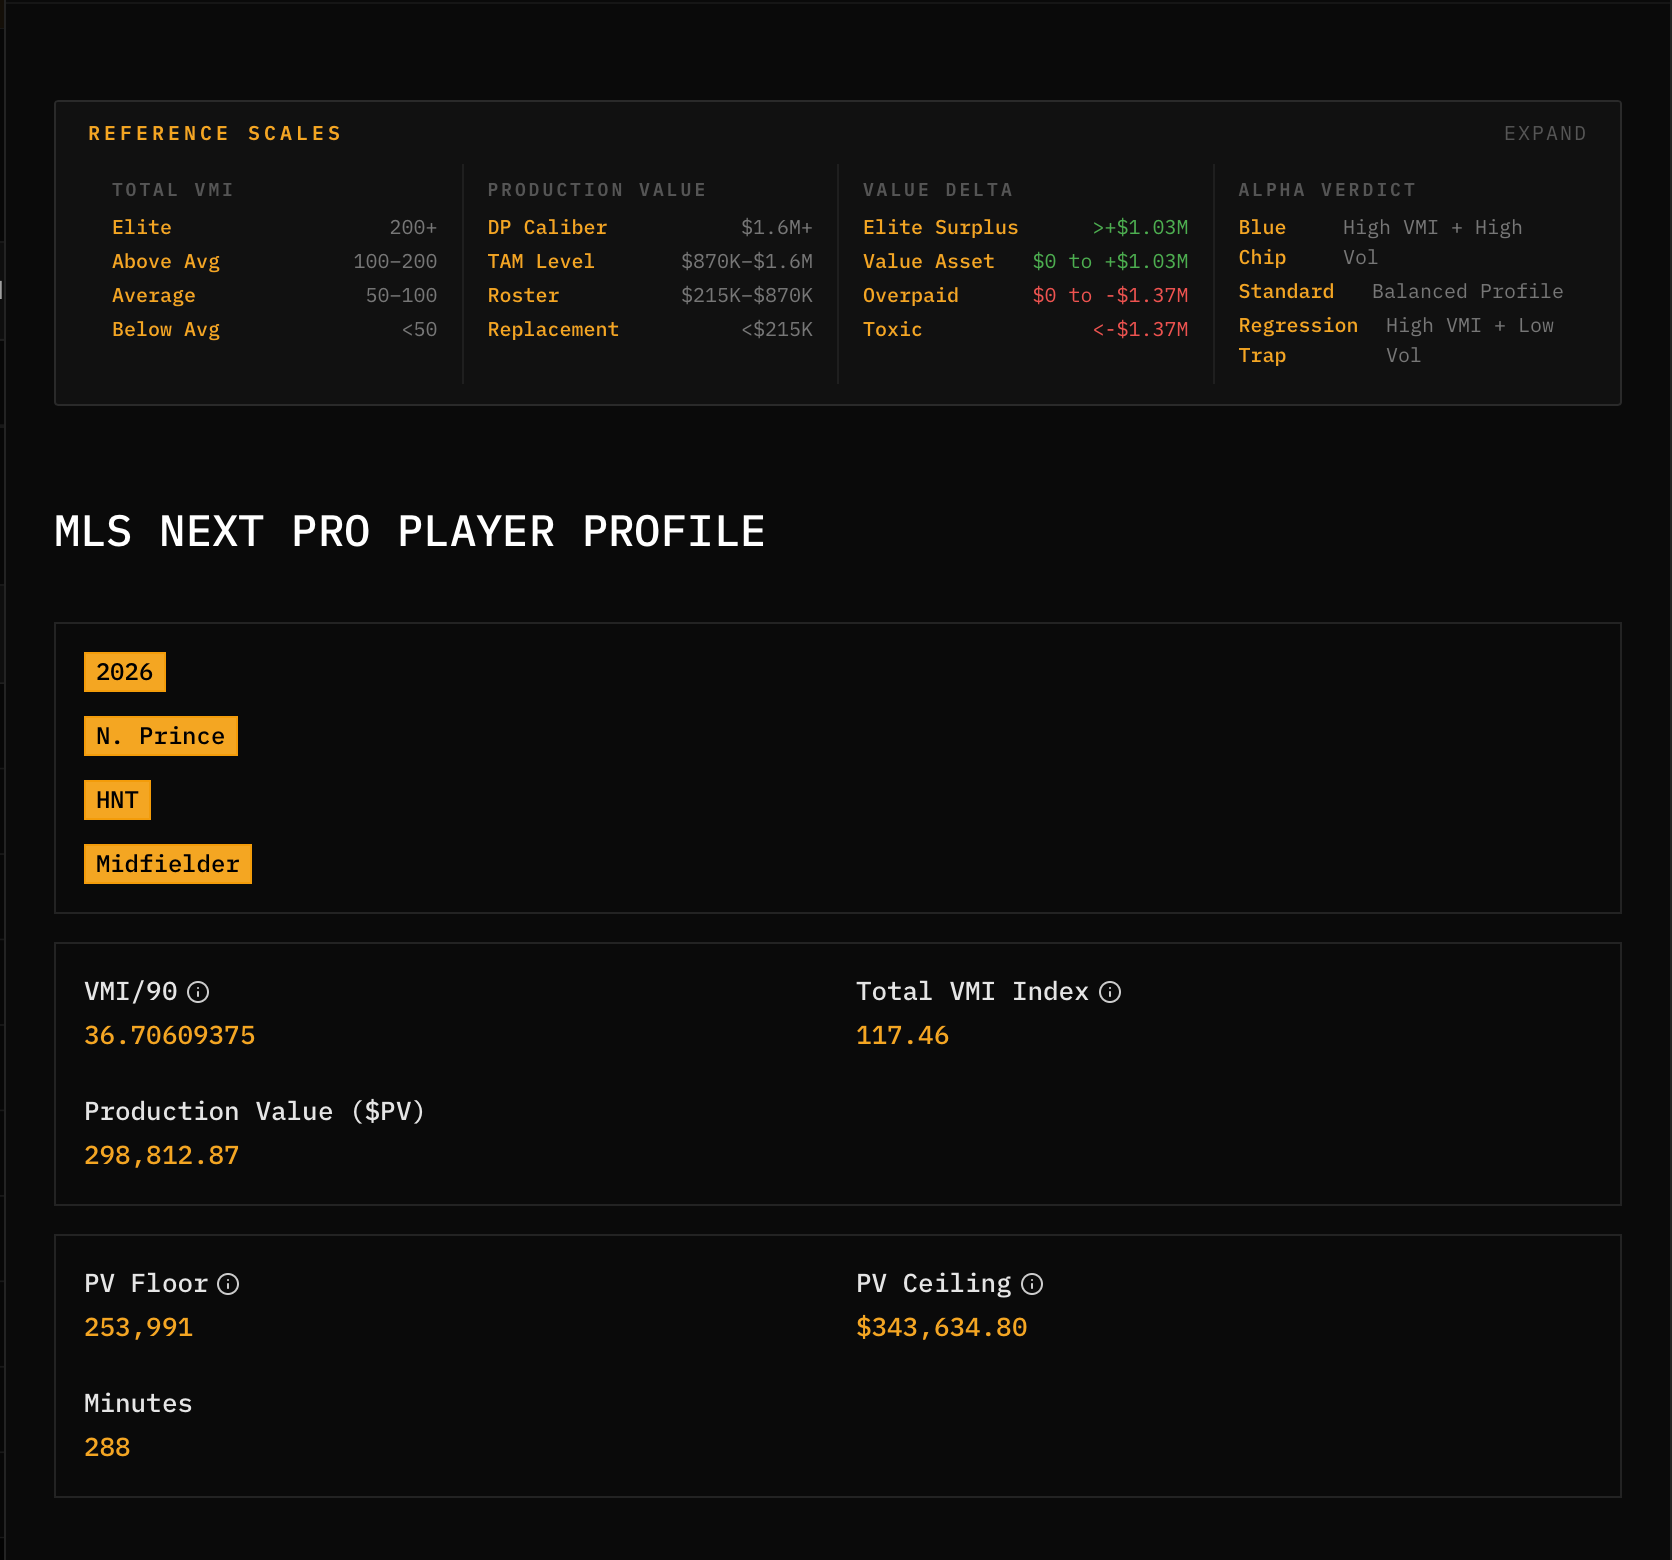
MLS NEXT Pro. 1,151 players. 30 clubs. Three seasons, 2023 through 2025, with live 2026 tracking. The developmental tier that feeds the first-team pipeline and the tier nobody else is covering with production valuation data. NEXT Pro VMI runs a parallel system calibrated specifically for developmental-league conditions, translating production into first-team-equivalent dollar value so that call-up decisions, loan evaluations, and pipeline assessments operate on the same financial language as the senior roster.
Combined: 2,164 unique players across both tiers.
The reports on this Substack are my interpretation of VMI findings coupled with real time information in the sports space.
VMI Converts On-Field Production Into Dollar Value Relative to Salary Cost
VMI (Value Momentum Index) converts on-field contributions into dollar value relative to salary cost. It produces three independent outputs the market currently prices as one:
Production Value ($PV). What is a player actually worth in dollars based on what they produce on the field? This is calculated from manually verified match-by-match contribution data, normalized against league-wide output.
Dual-axis evaluation. Every player is graded on two independent axes simultaneously:
Axis 1, Contract Efficiency:
Is this contract smart business? Five-step scale: ELITE SURPLUS / VALUE ASSET / FAIR / OVERPAID / TOXIC CONTRACT.
Axis 2, Production Tier:
How good is this player on the pitch? Four-step scale: DP CALIBER / TAM LEVEL / ROSTER CALIBER / REPLACEMENT LEVEL.
These axes are independent and must be read together.
Lionel Messi graded DP CALIBER on the pitch and TOXIC CONTRACT on the books ($6.87M $PV against $30.4M salary, 2025). A Homegrown depth piece can grade ROSTER CALIBER on production and ELITE SURPLUS on contract. The market conflates the two axes and the VMI separates them.
Value Delta. Production Value minus Guaranteed Compensation. Positive values indicate the player is outperforming the contract. Negative values indicate overpay.
Standard Market Wage. Projected contract benchmark at a standard 2,700-minute workload. Used for extension math, transfer targeting, and salary comparables across clubs.
VMI Alpha. Sustainability prediction. Rates match-by-match consistency on a twelve-step scale (A+ through F) to predict whether current production will hold or regress before a contract expires. Alpha answers the question every technical director asks on every extension decision: is this player real, or is this flash in the pan production that will collapse before year three?
The same framework architecture applies to MLS NEXT Pro with independent calibration for developmental-league conditions. NEXT Pro $PV translates developmental production into first-team-equivalent dollar value, enabling direct comparison between a prospect’s current output and the senior roster’s production benchmarks. This is the layer that makes pipeline decisions (call-ups, loans, Homegrown signings) all legible in the same financial terms as DP acquisitions.
The Track Record, Versioned
The VMI has been through two production specifications across six MLS seasons. I’m disclosing both because every analytical framework evolves and the numbers should be version-stamped.
V2 (2020–2025, six seasons, native specification per year). The original backtest ran each season through its contemporaneous calculation engine. Production Value ($PV) correlated with league points at r = 0.704 (R² = 49.6%), meaning a single production metric explained half of competitive variance across a league with salary caps, allocation money, and 30 different ownership structures. Total payroll explained 2.0%. The composite model achieved 89.1% playoff classification accuracy from player-level signals alone.
V3 (2023–2025, three seasons, xG-integrated specification). In early 2026 I rebuilt the calculation engine to integrate expected goals data and league-specific cap accounting structures.
V3 is the current production system.
When I re-ran the backtest on the V3 specification across its valid era (2023 onward, where the input data exists), the linear numbers shifted: r = 0.566 (R² = 32.1%), Spearman ρ = 0.57. Payroll dropped to R² = 1.3%. Production Value ($PV) still explains competitive outcomes at 24 times the rate of total payroll on a linear basis.
V3 retroapplied to 2020–2022 degraded because those seasons lack the xG data the new engine requires. That’s not a methodology failure nor is it a campaign for xG (it’s not) but it’s the expected result of applying a richer specification to years where the richer inputs don’t exist. The V2 numbers for those seasons remain valid under their original specification.
The per-year signal tells the fuller story.
2024 alone: r = 0.718 (R² = 51.5%), ρ = 0.743. This was the strongest single-season correlation in the dataset, under the current V3 specification. 2023 and 2025 run at R² = 25–28%.
The more precise test was the one that matched the question of playoff qualification. Qualification is binary (you make it or you don’t) so the correct diagnostic was a classification test over linear correlation. On that test, Production Value classified playoff teams at Area Under the Receiver Operating Characteristic Curve (AUC) = 0.81 across the three-season V3 era. So, if you pulled one playoff team and one eliminated team at random, $PV correctly identified which is which 81% of the time. 2024 alone hits AUC = 0.92.
Total payroll showed and still shows no statistically significant relationship with playoff qualification (p = 0.60).
None.
Playoff teams in the V3 era carried a median $PV of $23.6M versus $18.8M for eliminated teams, a $4.8M separation (p < 0.001). The logistic relationship between Production Value and qualification probability is steep and well-calibrated. Each incremental million dollars of $PV produced a measurable, consistent shift in odds, with the inflection point sitting in the high teens and saturation reaching above $25M. Production Value explained 93x more playoff variance than total payroll on the logistic model.
Translation: the market allocates capital on the wrong axis.
Full backtest results, including yearly ranking correlations and rank accuracy: Predictive Validity Backtest
MLS NEXT Pro. The developmental tier operates with a parallel VMI calibrated to translate NEXT Pro production into first-team-equivalent value. Across three V3 seasons (2023–2025, 85 team-seasons), NEXT Pro Production Value correlates with league points at r = 0.59–0.63 per season (R² = 35–40%) and classifies postseason teams at AUC = 0.70 pooled, with per-year AUC ranging from 0.71 to 0.86. The signal is real and statistically significant every season tested (p < 0.002). Cross-season NEXT Pro rank stability is near zero — developmental rosters turn over faster than senior rosters through call-ups, loans, age-outs, and Homegrown signings — reinforcing the same structural finding from the MLS stress test: VMI is an in-season instrument, not a pre-season forecast.
The Transactions Wire series tracks call-ups, loans, and signings against production data, measuring whether clubs promote the players the numbers say they should, and whether those players produce at the senior level once promoted. This is the only publication producing dollar-denominated developmental production valuation at the MLS NEXT Pro level.
I also stress-tested the model against its own failure points.
Cross-season VMI values degrade to near-coin-flip accuracy due to MLS roster churn. Within-season, the signal reaches statistical significance (p < 0.001) at Match Week 15 with 69% accuracy on decided matches across 2,761 regular season games. I published the full methodology disclosure (including where the model broke) because every analytical product has boundaries and I believe mine should be public.
VMI vs. Polymarket, Player Fits, Club Diagnostics, NEXT Pro Wire
The publication runs four recurring formats plus structural analysis.
VMI vs. Polymarket. A weekly prediction series benchmarking VMI signals against Polymarket MLS match odds in order to validate further and to provide deeper intelligence to Polymarket's sports partners. Friday pre-match calls and Monday outcome reconciliation all time-stamped, blind, and verifiable.
Player Fit Analyses. When a transfer rumor breaks, VMI runs every MLS club through a four-filter structural test: defensive integrity, positional gap, competitive standing, and Efficiency Delta discipline. I do this to identify the optimal destination and to combat narrative media index inflation. The market picks on commercial logic and the VMI picks on structure. Published series: Lewandowski / Bernardo Silva
Club Diagnostics. Production-value teardowns of club collapses, roster imbalances, and structural misallocations. How MLS runs two roster models and why one is structurally failing: MLS Roster Construction Efficiency Model
MLS NEXT Pro Wire. Production valuation at the developmental tier. 1,151-player NEXT Pro dataset, 2023 through 2025, with monthly transaction wires evaluating first-team call-ups against production data. Issue #001
Market Structure. Structural reads on how the market misprices: why narrative pricing indexes fail (The Trouble With Narrative Pricing Indexes), why San Jose is mispriced at 1¢ in MLS Cup futures (MLS Cup Futures vs. VMI), and why offseason grades need production data, not vibes (MLS Offseason by Production Value).
Coverage in 2026 now spans MLS, MLS NEXT Pro, EFL Championship, EFL 1 & 2, Ligue 1 and Ligue 2, La Liga EA SPORTS and La Liga HYPERMOTION, Bundesliga and 2. Bundesliga, Liga Portugal and Liga Portugal 2, UEFA club competitions (UCL, UEL, UECL), and NWSL. FIFA World Cup 2026 will be live on the terminal this summer.
The VMI framework is sport-agnostic at the structural level. It measures production value relative to compensation cost. The calibration changes by league but the logic doesn't.
VMI Terminal Is Live at turnstilehq.co
VMI Terminal, the underlying platform, is live at turnstilehq.co.
All six years of verified MLS production data plus three years of MLS NEXT Pro developmental valuation. Every player valued, every contract graded, every roster auditable is there.
The interpretation is the product. Turnstile publishes multiple times per week on Substack. There is no set cadence because the market moves fast, I match that with my publishing.
The data tells you what happened. My reports tell you what it means and what to do about it.
Emmanuel Smith
Turnstile | Production, valuation, and in-season predictive intelligence for the MLS ecosystem
Institutional access (clubs, funds, prediction markets): institutional@turnstilehq.co
© 2026 Turnstile Sports Business Intelligence, LLC. All rights reserved.